Engineering prototype · 2026
Daily Production Forecasting
Windows application for field-wide production scenarios that account for natural decline, workovers and ramp-up
Data and validation
The application combines well operating records, actual starts and shut-ins, the workover schedule, well classifications and approved changes. Users review schedule conflicts, missing dates, unrecognized job types and incomplete return-to-production assumptions. Blocking issues must be resolved before a run. The decisions are stored separately from the source files.
How the forecast works
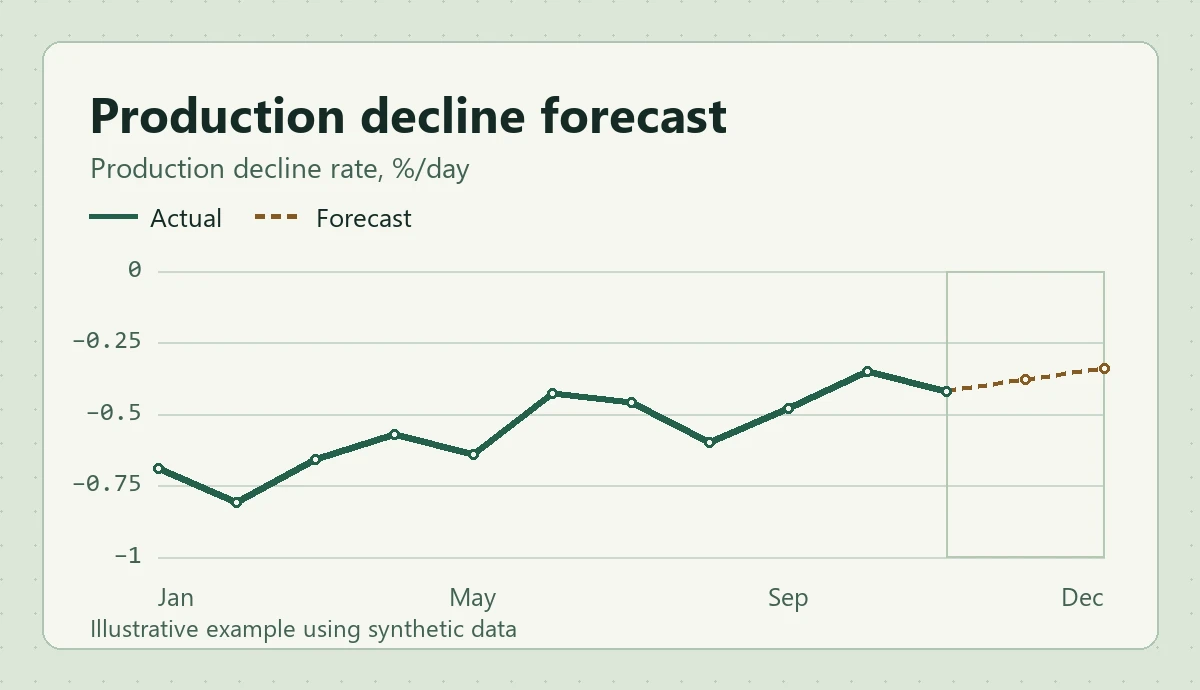
Decline is estimated over independent intervals between changes in operating conditions. Duplicate and reconstructed observations do not inflate the sample. Base and incremental-production well groups use separate estimates by field and category. Eligible well-specific history can be included. Selected intervention groups use daily response curves by field and work type, with an explicit fallback for sparse data.
A scheduled workover pauses production. The well then ramps up to a specified rate under a separate rule, with natural decline applied after the linear ramp-up. Changes in production can be attributed to decline, workovers, ramp-up, starts and other operating changes.
From portfolio totals to a single day
The well-by-day matrix shows oil and liquid rates, water cut and the applied decline rate. A well profile compares actuals and forecasts, traces the rate assumption on a selected date, and shows the underlying operating records and intervals. Overrides can be documented and run in a new version. The Excel export retains the forecast and its basis.
Fitting post-intervention response curves
In version 0.5.6, I added a constant-rate model and a decay-to-plateau model. Engineers can select a group and range, exclude intervals or complete episodes and compare the fitted curve with the observed median. RMSE, bias and R² are reported. Where sample size permits, entire wells are held out. Forecast accuracy against future production still requires a separate time-based backtest.
- My role
- Methodology design and software development
- Tools
- Python and Excel
- Result
- Working prototype 0.5.6 · 200 automated release tests passed
Have a similar engineering challenge?
If you're reviewing a production forecast or comparing workover schedules, message me to discuss the objective and what data you have.