Production enhancement · INK
Well Surveillance
Engineering prototype that brings together well operating histories and shows performance changes at individual-well and field scale using validated data
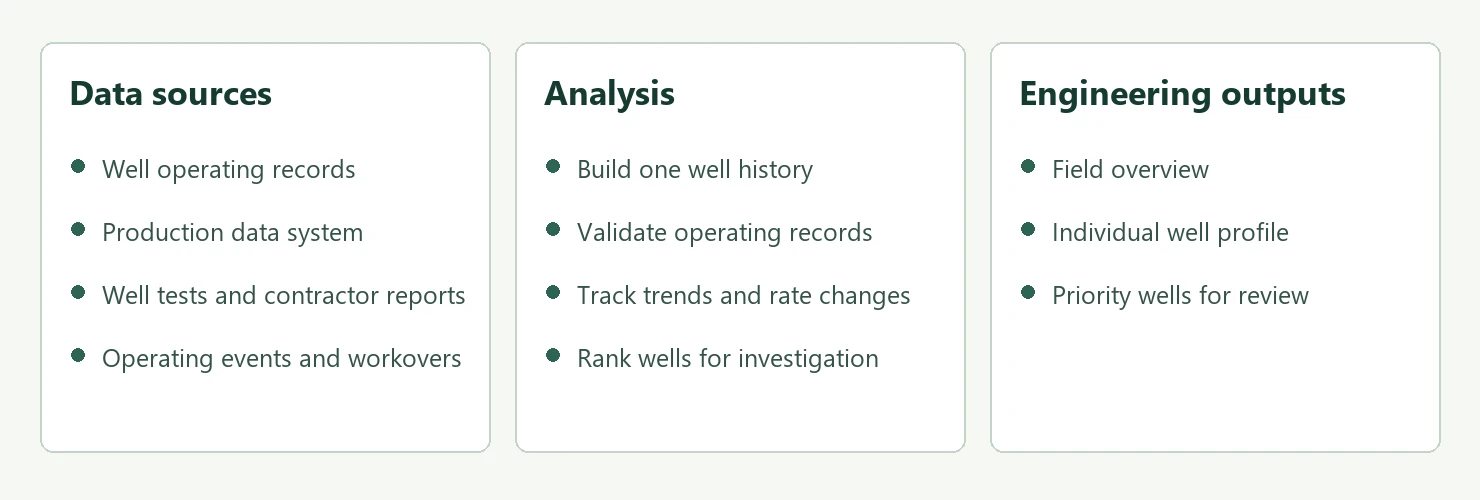
An integrated well history
I combined well operating records, production measurements, well tests and operating events. Starts, shut-ins, workovers and near-wellbore treatments appear on a single timeline, so engineers can compare changes in rate, water cut or pressure with events before and after the change.
Well operating data validation
Calculations use validated data. The module checks required fields, well IDs, operating status and acceptable ranges for rates, water cut and pressure. It compares the current operating record with the previous one and flags discrepancies by well. Changes in reservoir pressure are flagged separately.
Field-wide performance
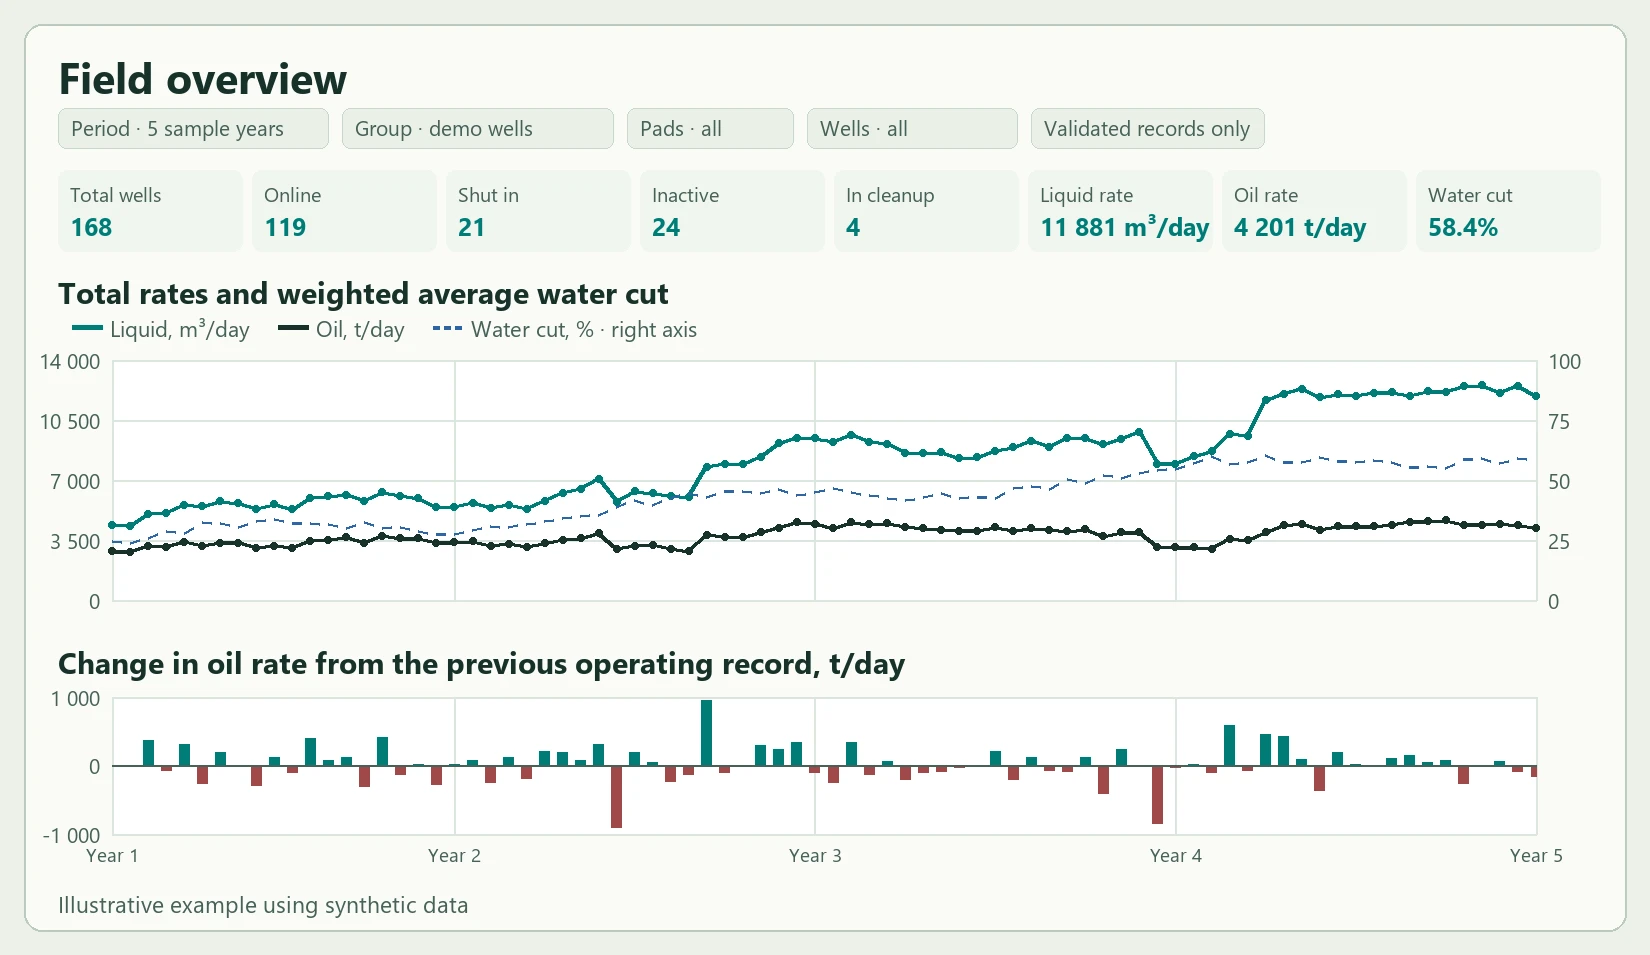
Engineers can choose any available period, from days to years, and filter by field, pad, well or source. The overview tracks total rates, weighted average water cut and well counts by status. A change at field scale can be traced to the wells that contributed to it and to the events that coincided with it.
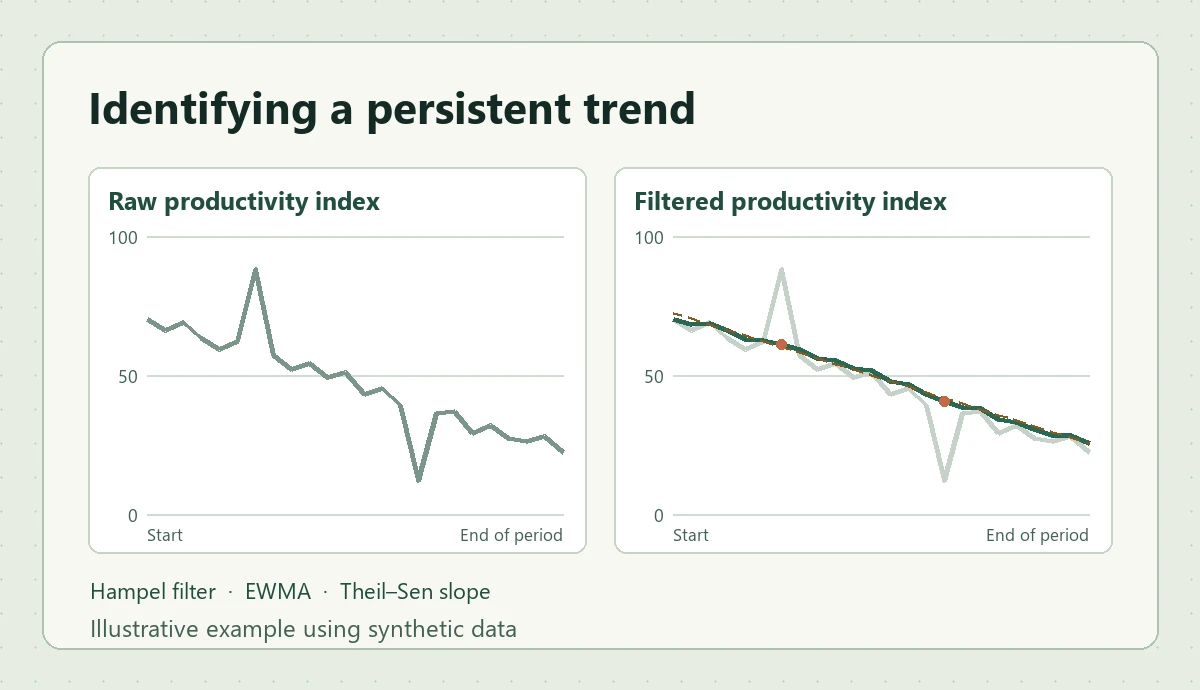
Identifying a persistent trend
The productivity index shows how raw history becomes a ranking signal. A Hampel filter limits the effect of individual anomalies, EWMA smooths the series, and the Theil–Sen slope estimates the persistent rate of change. In the right panel, the dotted line shows the trend and the markers show corrected outliers.
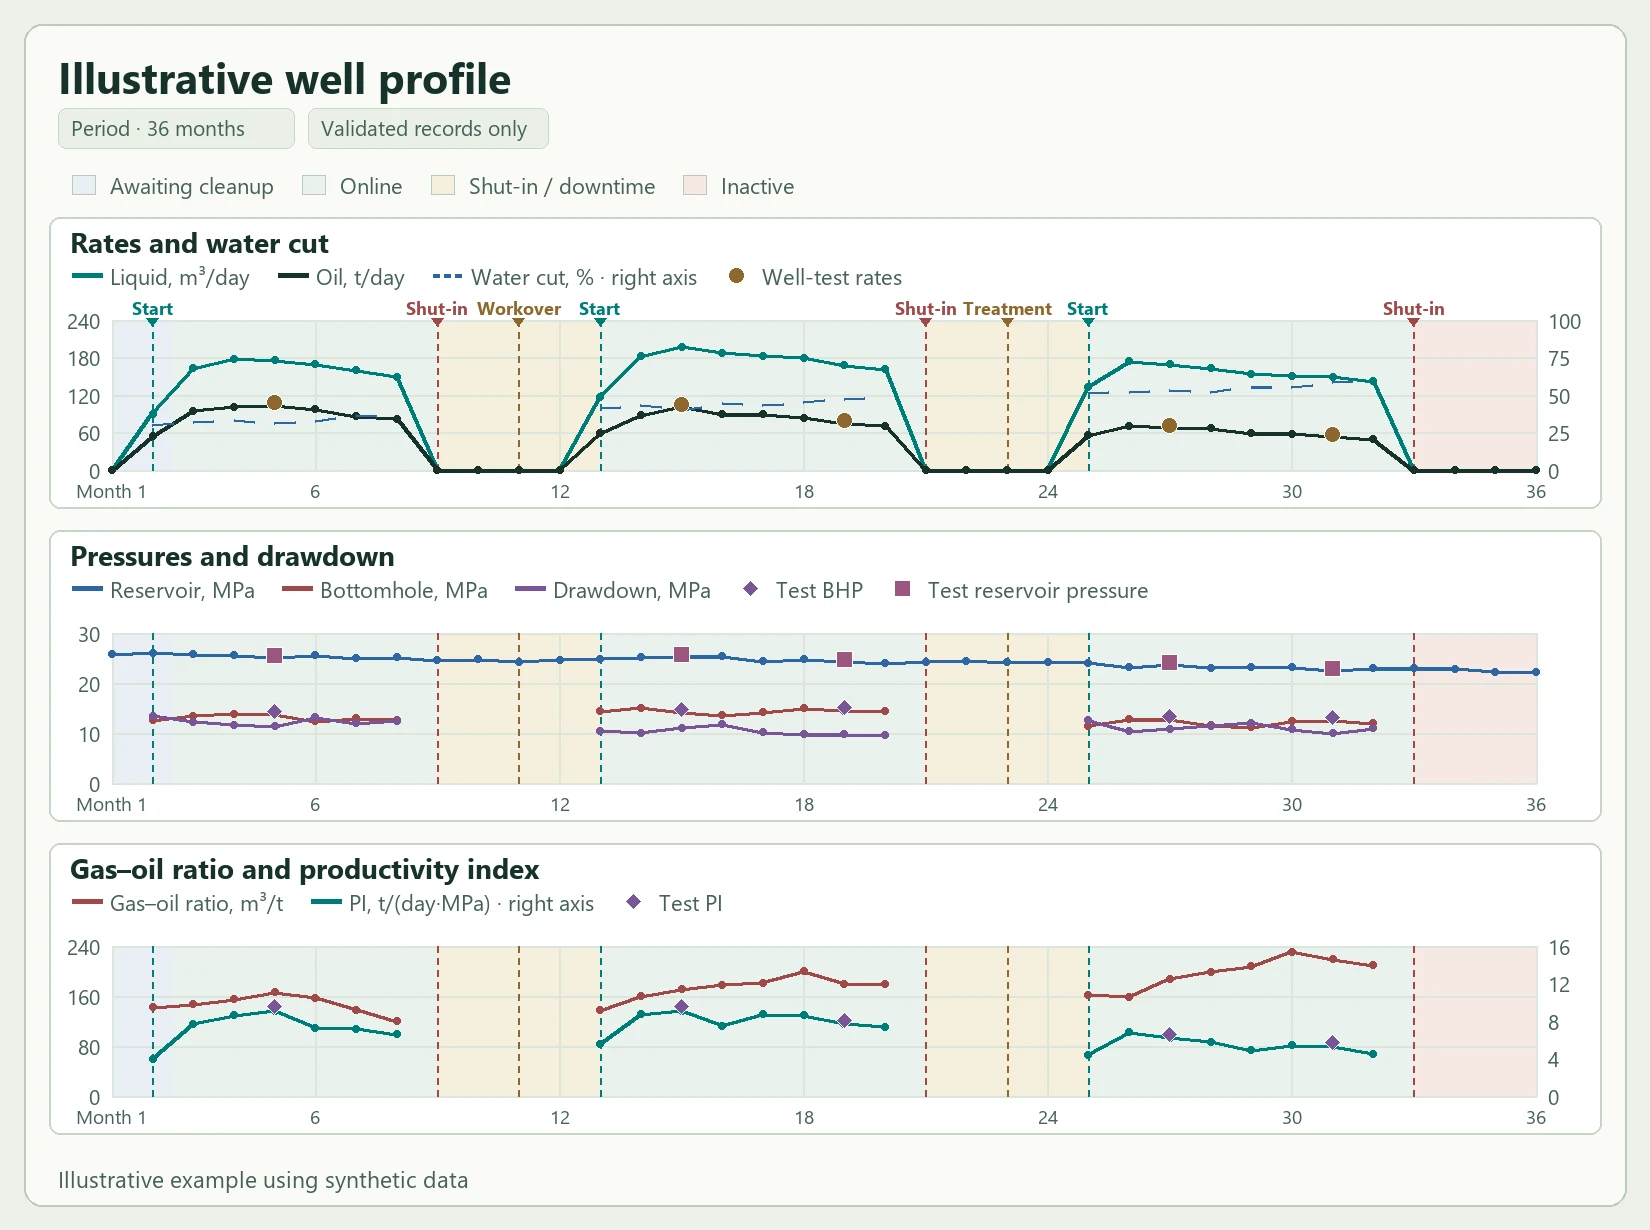
Individual well profile and review priorities
The profile shows rates, water cut, reservoir and bottomhole pressures, drawdown, gas–oil ratio and productivity index on a shared timeline. Well-test points and operating events are overlaid. Engineers can see how production recovered after a workover or treatment and whether the change persisted.
Rankings by individual indicator and a combined index (IDR) help determine which wells to review first. Engineers can trace a signal back to its measurements and intervention history before making a decision.
Field production measurements
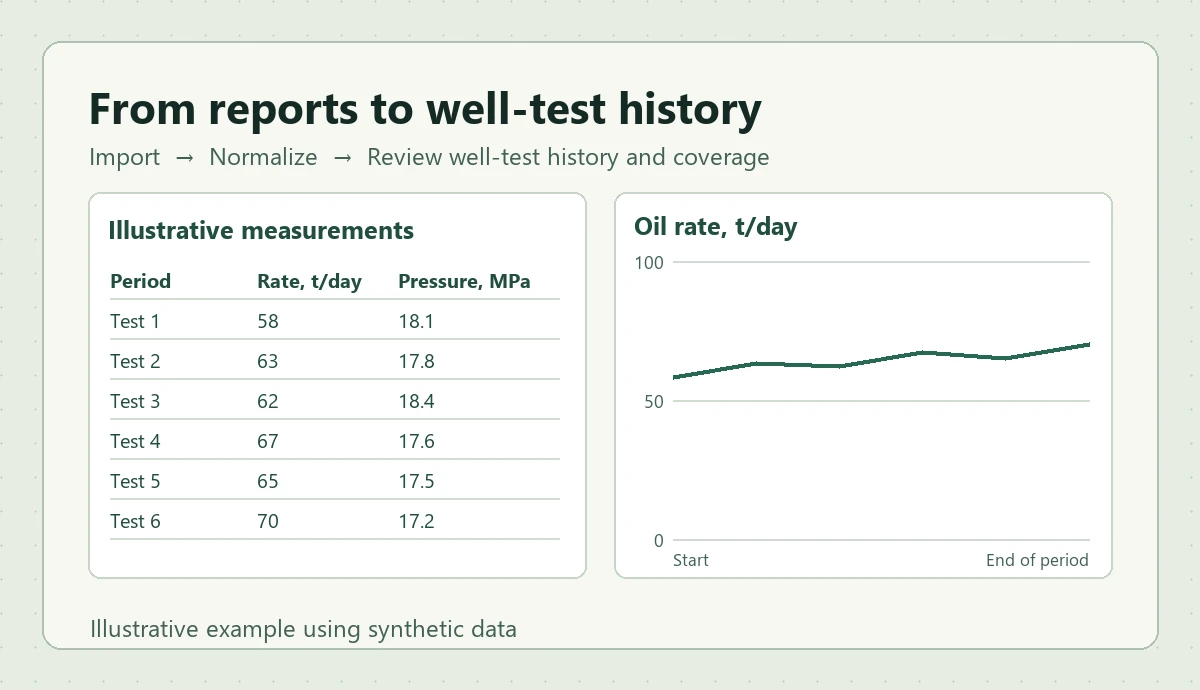
The module normalizes measurement reports and builds a history for each well. Engineers can see when tests were performed, how indicators changed and which wells need retesting. Problematic and cancelled measurements can be filtered for review.
Application
The prototype was used to screen intervention candidates, validate operating data and identify wells where reservoir pressure needed review. The engineer checks the well history to investigate deviations and choose the next action.
- My role
- Problem definition, algorithm design and prototype development
- Tools
- Python and Excel
- Result
- Integrated well history, field-level overview and quality checks for well operating records
- Application
- Investigating deviations, screening intervention candidates and reviewing reservoir pressure
Have a similar engineering challenge?
If you're consolidating well histories or setting up well surveillance, message me and we can discuss where to start.